Measurement
Dielectric Measurement
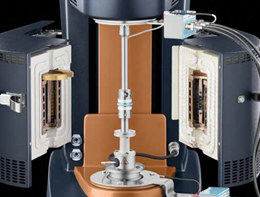
The Dielectric Accessory, available for all DHR models, extends material characterization capabilities by providing an additional technique similar to dynamic mechanical. In dielectric analysis, an oscillation electrical field (AC Field) is used as opposed to mechanical force (stress) and the oscillating strain is a stored charge (Q) in the sample. The technique measures the degree to which the sample is storing a charge (capacitance) or passing a charge (conductance) through its bulk. The DHR provides a flexible platform for easy test setup and calibration, and data accuracy through standard features such as the Environmental Test Chamber, axial force control, and gap temperature compensation routines. Dielectric analysis is a very powerful technique for characterizing polar materials such as PVC, PVDF, PMMA, and PVA, for phase separating systems, and for monitoring curing kinetics of materials such as epoxy and urethane systems. Dielectric analysis extends the measurable frequency range over traditional dynamic mechanical analysis which is typically limited to 100 Hz.

Technology
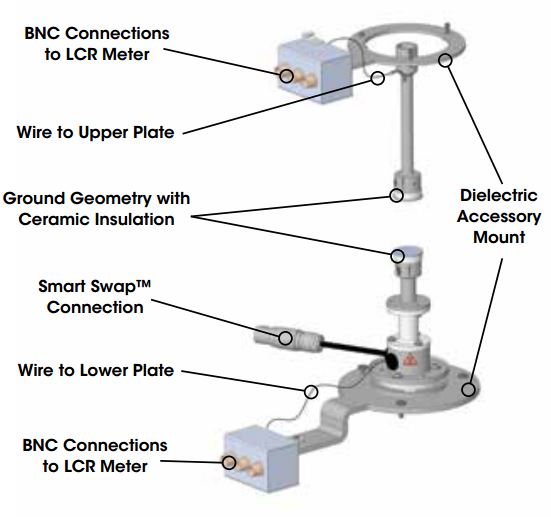
The Dielectric accessory consists of a special set of 25 mm parallel plates that are fitted with wiring and hardware for interfacing with a dielectric LCR meter (Keysight E4980A or E4980AL LCR) that imposes a signal at a certain voltage and frequency/ies. The voltage range available is between 0.005 to 20 V with a frequency range of 20 Hz to 2 MHz. The Environmental Test Chamber (see page 26) provides temperature control over a range of -160 °C to 350 °C. The accessory allows for the simultaneous collection of rheological and dielectric information, or dielectric measurements can be run independently.
Features and Benefits
- Smart Swap technology
- 25 mm diameter plates with ceramic insulation
- Disposable plates for curing system
- Stand-alone dielectric measurements
- Combined rheological and dielectric measurements
- Fully programmable from TRIOS Software
- Time-Temperature Superposition
- Master curve generation
- Wide dielectric frequency range: 20 Hz to 2 MHz
- Easy installation and removal
- Compatible with ETC over a temperature range of -160 °C to 350 °C
- USB Interface
Phase Separation in Cosmetic Creams

Phase Separation in Cosmetic Creams
Temperature stability of materials such as food and cosmetics is very important for product performance in storage and transportation. Rheological testing is widely used for stability evaluations; however, the ability to simultaneously measure dielectric properties can provide more valuable insight for complex formulations. An example is shown in the figure to the right for two water-based cosmetic creams tested by cooling from 25 °C down to -30 °C. In comparing only storage modulus, G’, data of the two materials, the POND’S cream shows little increase followed by a three decade jump at -18 °C, but NIVEA cream exhibits a more continuous change in the modulus over the entire temperature range. One may conclude from the mechanical response alone that the large jump in G’ of POND’S at -18 °C is associated with instability. However, having the simultaneous measurement of the loss permittivity, ε”, provides information relating to the change in ion mobility; primarily of the water phase in these samples. In the ε” the NIVEA shows a two decade jump compared to very little change in the ε” of the POND’S. The large increase in ε” is due to increased ion mobility in the material as the water separates. In the final analysis, phase separation occurs in the NIVEA, not the POND’S. During the cooling process, as phase separation gradually occurs, the water phase grows changing the morphology. As the morphology gradually changes, so too does the G’. The large change in G’ of the POND’S is the result of a transition of a more stable and uniform morphology.
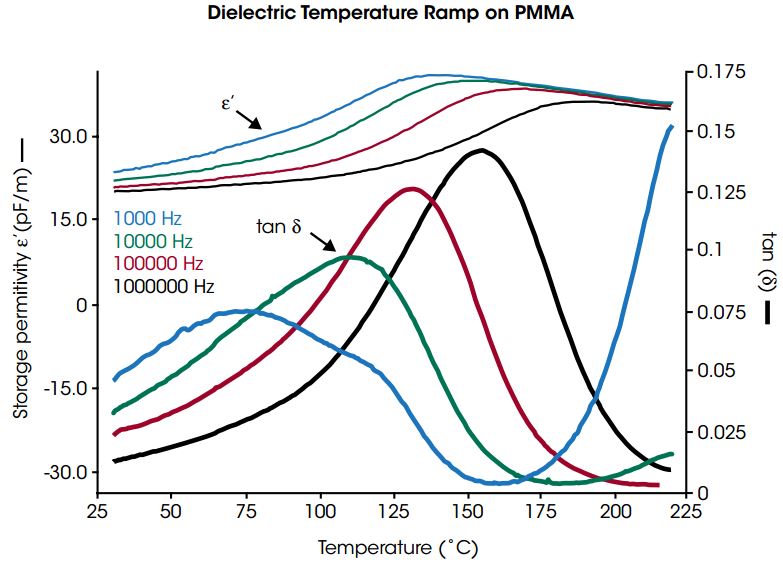
Dielectric Temperature Ramp at Multiple Frequencies

Dielectric Temperature Ramp at Multiple Frequencies
The figure to the right shows a temperature ramp on a Poly (methyl methacralyte), PMMA, sample at four different dielectric frequencies ranging from 1,000 Hz to 1,000,000 Hz. It can be seen here that the magnitude of ε’ decreases with increasing frequency through the transition region and the peak of the transition in tan δ moves to higher temperatures with increasing frequency.


